This geom is used to plot college football team and conference logos instead
of points in a ggplot. It requires x, y aesthetics as well as a valid CFB
team name or abbreviation. The latter can be checked with valid_team_names().
geom_cfb_logos(
  mapping = NULL,
  data = NULL,
  stat = "identity",
  position = "identity",
  ...,
  na.rm = FALSE,
  show.legend = FALSE,
  inherit.aes = TRUE
)
Arguments
- mapping
Set of aesthetic mappings created by
aes()oraes_(). If specified andinherit.aes = TRUE(the default), it is combined with the default mapping at the top level of the plot. You must supplymappingif there is no plot mapping.- data
The data to be displayed in this layer. There are three options:
If
NULL, the default, the data is inherited from the plot data as specified in the call toggplot().A
data.frame, or other object, will override the plot data. All objects will be fortified to produce a data frame. Seefortify()for which variables will be created.A
functionwill be called with a single argument, the plot data. The return value must be adata.frame, and will be used as the layer data. Afunctioncan be created from aformula(e.g.~ head(.x, 10)).- stat
The statistical transformation to use on the data for this layer, as a string.
- position
Position adjustment, either as a string, or the result of a call to a position adjustment function.
- ...
Other arguments passed on to
ggplot2::layer(). These are often aesthetics, used to set an aesthetic to a fixed value. See the below section "Aesthetics" for a full list of possible arguments.- na.rm
If
FALSE, the default, missing values are removed with a warning. IfTRUE, missing values are silently removed.- show.legend
logical. Should this layer be included in the legends?
NA, the default, includes if any aesthetics are mapped.FALSEnever includes, andTRUEalways includes. It can also be a named logical vector to finely select the aesthetics to display.- inherit.aes
If
FALSE, overrides the default aesthetics, rather than combining with them. This is most useful for helper functions that define both data and aesthetics and shouldn't inherit behaviour from the default plot specification, e.g.borders().
Aesthetics
geom_cfb_logos() understands the following aesthetics (required aesthetics are in bold):
x - The x-coordinate.
y - The y-coordinate.
team - The team name or abbreviation. Must be one of
valid_team_names().alpha = NULL- The alpha channel, i.e. transparency level, as a numerical value between 0 and 1.colour = NULL- The colour of the image. Managed with scale_color_*angle = 0- The angle of the image as a numerical value between 0° and 360°.hjust = 0.5- The horizontal adjustment relative to the given x coordinate. Must be a numerical value between 0 and 1.vjust = 0.5- The vertical adjustment relative to the given y coordinate. Must be a numerical value between 0 and 1.width = 1.0- The desired width of the image innpc(Normalised Parent Coordinates). The default value is set to 1.0 which is big but it is necessary because all used values are computed relative to the default. A typical size iswidth = 0.075(see below examples).height = 1.0- The desired height of the image innpc(Normalised Parent Coordinates). The default value is set to 1.0 which is big but it is necessary because all used values are computed relative to the default. A typical size isheight = 0.1(see below examples).
Examples
# \donttest{
library(cfbplotR)
library(ggplot2)
team <- valid_team_names()
team <- team[1:32]
df <- data.frame(
a = rep(1:8, 4),
b = sort(rep(1:4, 8), decreasing = TRUE),
teams = team
)
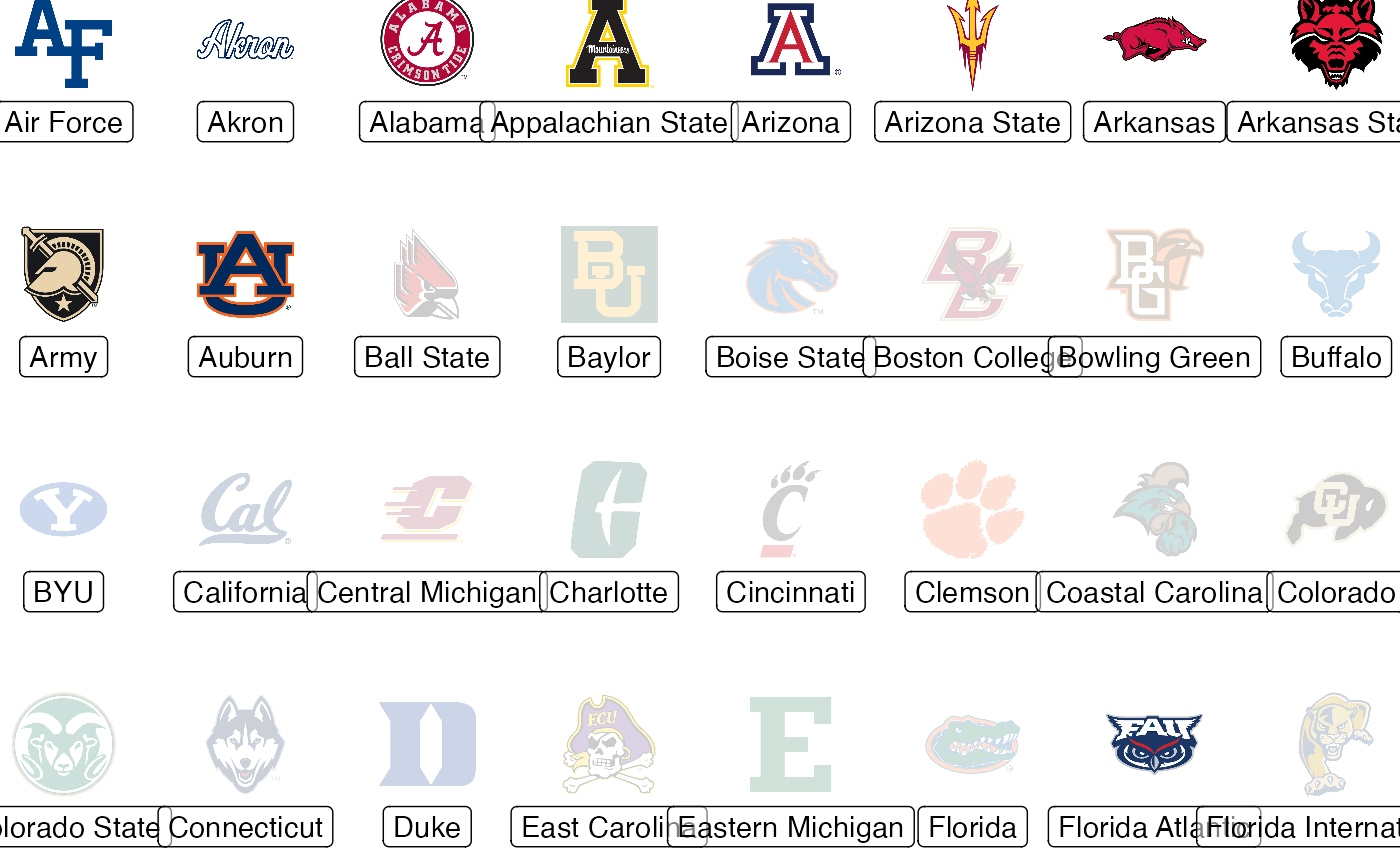
# keep alpha == 1 for all teams including an "A"
matches <- grepl("A", team)
df$alpha <- ifelse(matches, 1, 0.2)
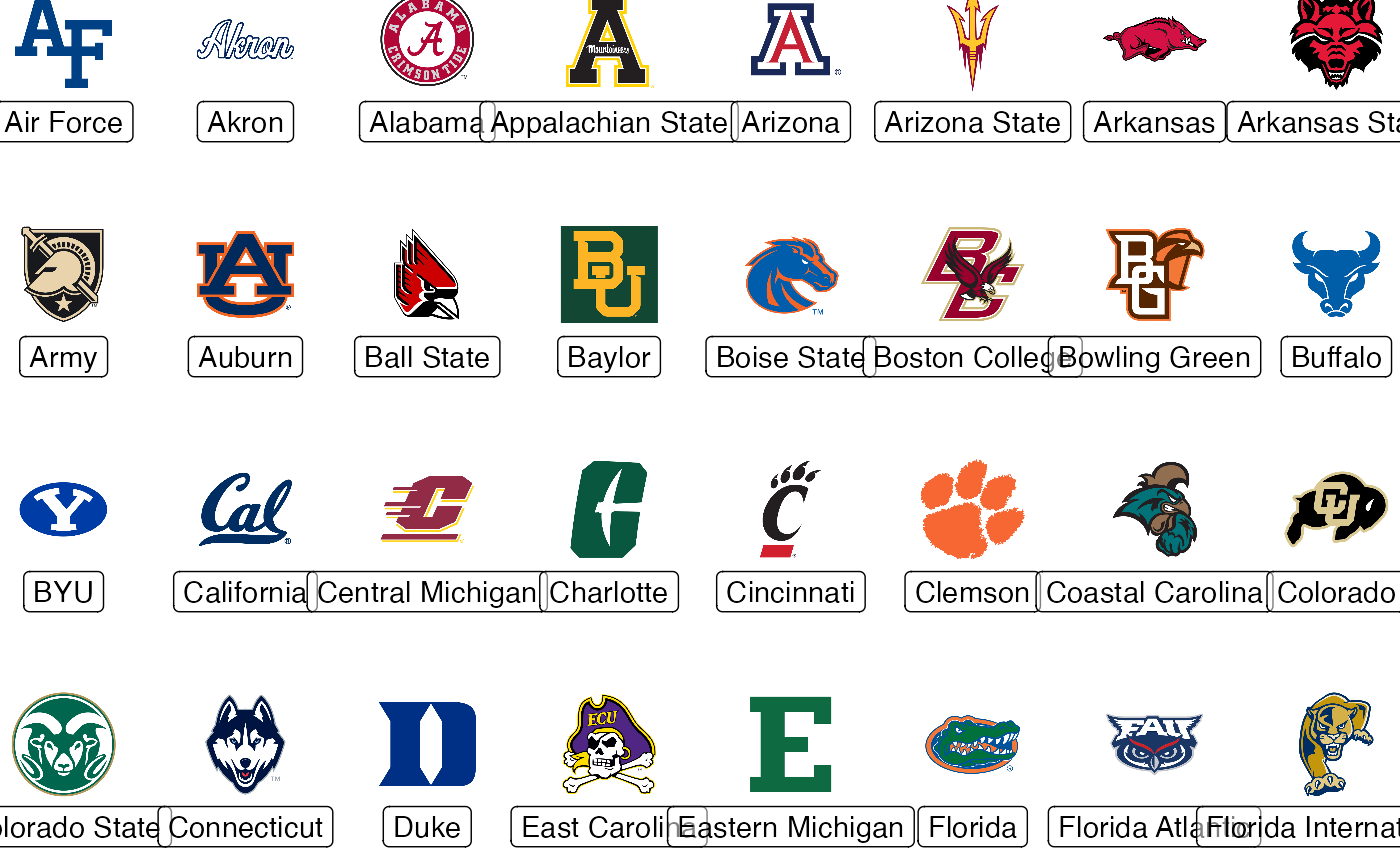
# scatterplot of all logos
ggplot(df, aes(x = a, y = b)) +
geom_cfb_logos(aes(team = teams), width = 0.075) +
geom_label(aes(label = teams), nudge_y = -0.35, alpha = 0.5) +
theme_void()
 # apply alpha via an aesthetic from inside the dataset `df`
ggplot(df, aes(x = a, y = b)) +
geom_cfb_logos(aes(team = teams, alpha = alpha), width = 0.075) +
geom_label(aes(label = teams), nudge_y = -0.35, alpha = 0.5) +
scale_alpha_identity() +
theme_void()
# apply alpha via an aesthetic from inside the dataset `df`
ggplot(df, aes(x = a, y = b)) +
geom_cfb_logos(aes(team = teams, alpha = alpha), width = 0.075) +
geom_label(aes(label = teams), nudge_y = -0.35, alpha = 0.5) +
scale_alpha_identity() +
theme_void()
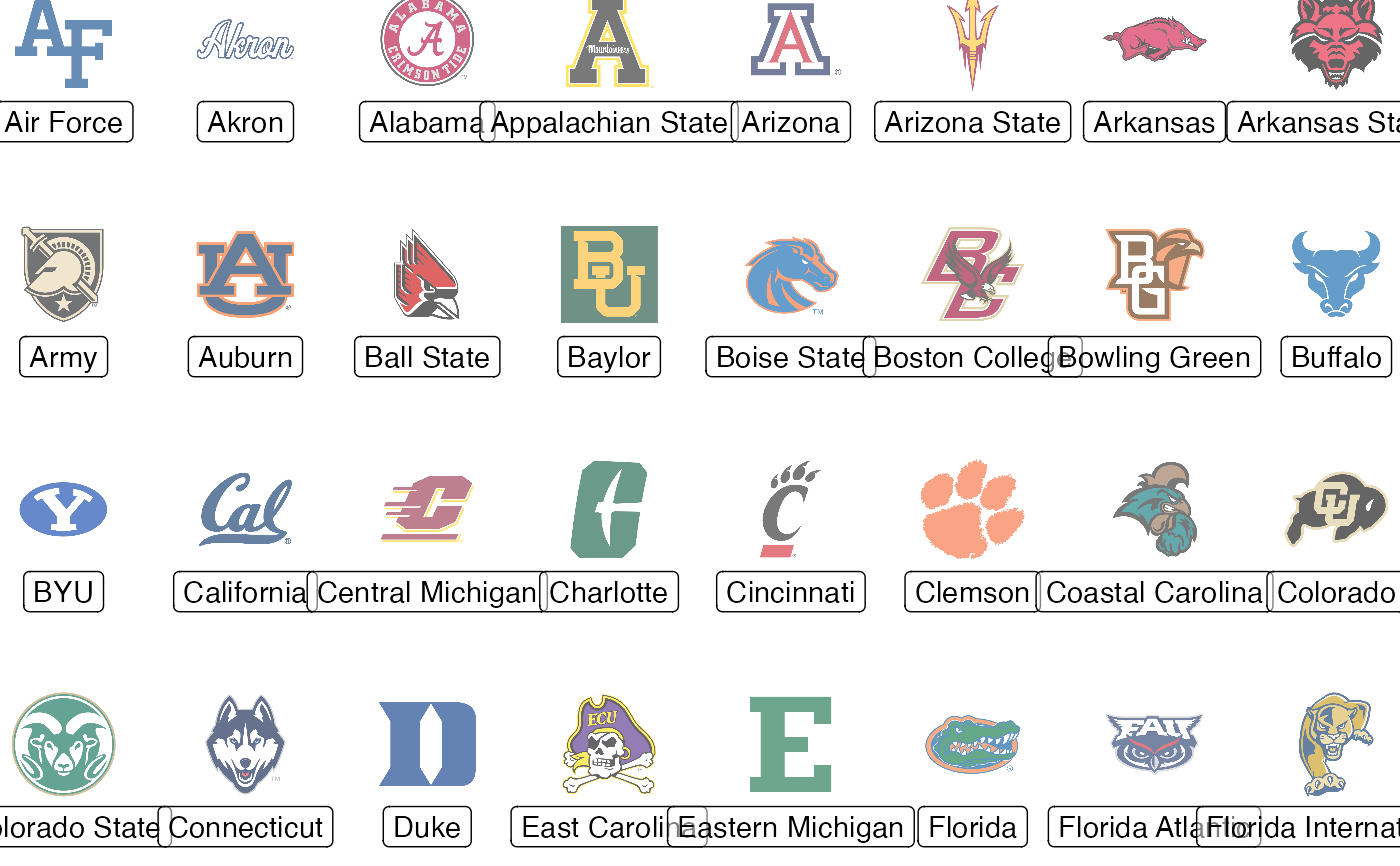
 # apply alpha as constant for all logos
ggplot(df, aes(x = a, y = b)) +
geom_cfb_logos(aes(team = teams), width = 0.075, alpha = 0.6) +
geom_label(aes(label = teams), nudge_y = -0.35, alpha = 0.5) +
theme_void()
# apply alpha as constant for all logos
ggplot(df, aes(x = a, y = b)) +
geom_cfb_logos(aes(team = teams), width = 0.075, alpha = 0.6) +
geom_label(aes(label = teams), nudge_y = -0.35, alpha = 0.5) +
theme_void()
 # it's also possible to plot conference logos
conf <- data.frame(a = 1:2, b = 0, teams = c("Pac-12", "ACC"))
ggplot(conf, aes(x = a, y = b)) +
geom_cfb_logos(aes(team = teams), width = 0.3) +
geom_label(aes(label = teams), nudge_y = -0.4, alpha = 0.5) +
coord_cartesian(xlim = c(0.5,2.5), ylim = c(-0.75,.75)) +
theme_void()
# it's also possible to plot conference logos
conf <- data.frame(a = 1:2, b = 0, teams = c("Pac-12", "ACC"))
ggplot(conf, aes(x = a, y = b)) +
geom_cfb_logos(aes(team = teams), width = 0.3) +
geom_label(aes(label = teams), nudge_y = -0.4, alpha = 0.5) +
coord_cartesian(xlim = c(0.5,2.5), ylim = c(-0.75,.75)) +
theme_void()
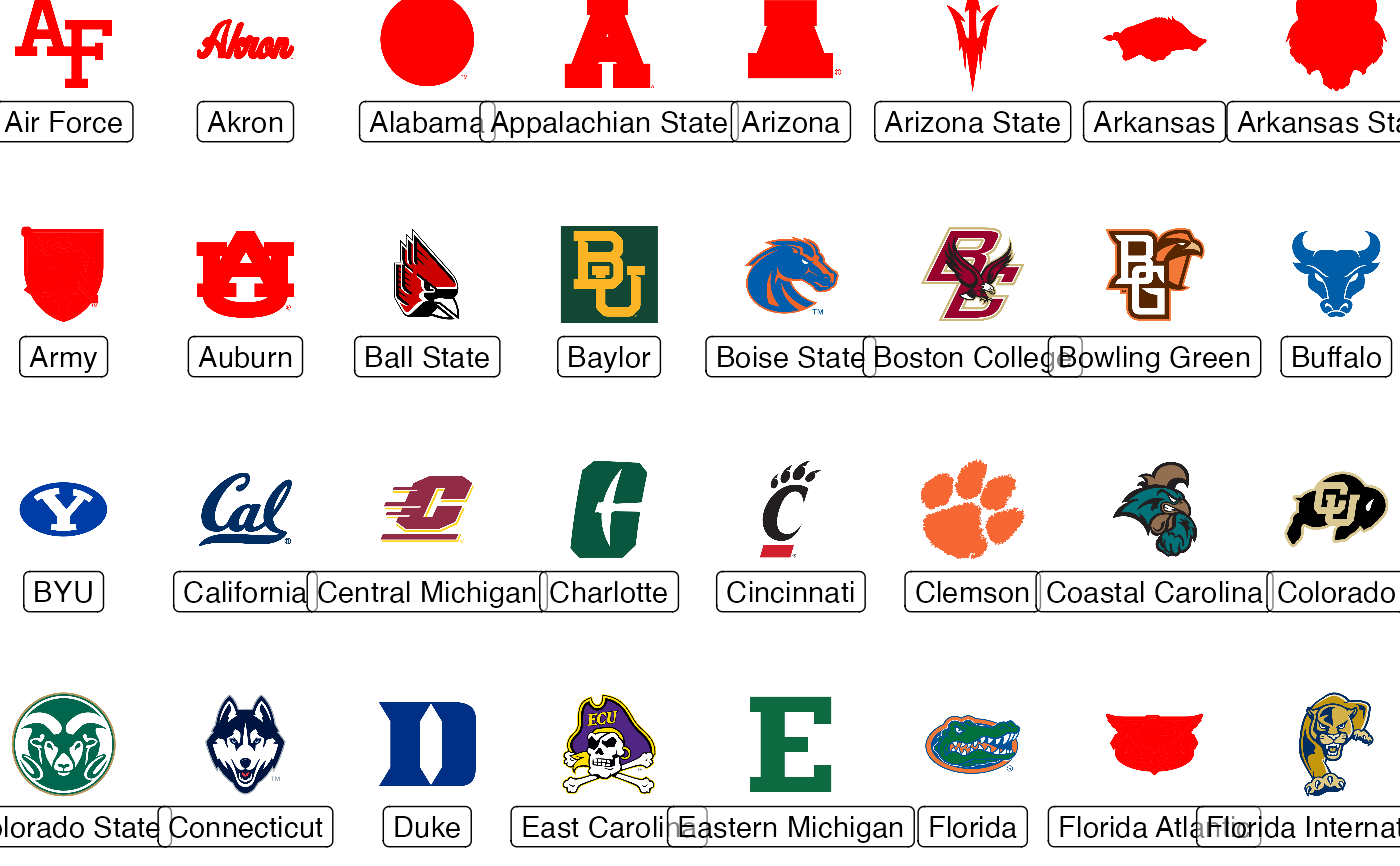
 # it's also possible to color the logos
# make teams with an A red
df$color <- ifelse(matches, "red", NA)
ggplot(df, aes(x = a, y = b)) +
geom_cfb_logos(aes(team = teams, color = color), width = 0.075) +
geom_label(aes(label = teams), nudge_y = -0.35, alpha = 0.5) +
scale_color_identity() +
theme_void()
# it's also possible to color the logos
# make teams with an A red
df$color <- ifelse(matches, "red", NA)
ggplot(df, aes(x = a, y = b)) +
geom_cfb_logos(aes(team = teams, color = color), width = 0.075) +
geom_label(aes(label = teams), nudge_y = -0.35, alpha = 0.5) +
scale_color_identity() +
theme_void()
 # }
# }